4 Steps to create Yamazumi Chart
+ 2 Quotes and 1 Image to kindle your thoughts
1 Article for the Week:
Yamazumi charts are great for organisation who want to boost productivity. They help identify wastes (Muda), uneven workloads (Mura), and overburdening workers (Muri). By visualizing this information, teams can better decide how to redistribute tasks and improve workflows.
What is Yamazumi Chart?
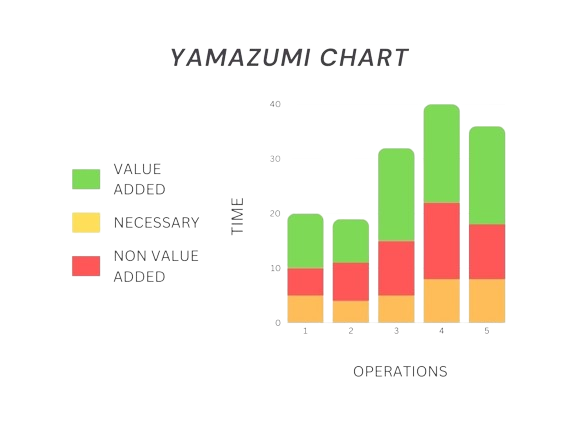
"Yamazumi" means "stacking up" in Japanese. A Yamazumi chart shows tasks stacked in a bar graph format, making it easy to see how much time is spent on each task. The X-axis shows different workers or workstations, while the Y-axis shows the time taken for each task.
How to Create a Yamazumi Chart?
Step 1: Collect Data
Measure the time it takes to complete each step in your process. You can do this in two ways:
Gemba Walks: Visit the work area, observe workers, and record how long each task takes.
Video Recording: Film the tasks being performed and analyze the footage to get cycle times.
Step 2: Classify Tasks
Sort the tasks into three categories:
Value Added Tasks (Green): Tasks that improve the final product.
Non-Value Added Tasks (Red): Tasks that don’t contribute value.
Necessary Non-Value Added Tasks (Yellow): Required tasks for legal or operational reasons but do not add value to the final product.
Step 3: Create the Chart
Using Excel,
Set Up Axes: Open Excel. Label the X-axis for processes or workers and the Y-axis for time.
Enter Data: Fill in the data with stacked bars, using colours to represent the task categories.
Add Target Line: Include a dotted line to show the ideal time for tasks.
Step 4: Analyze the Chart
Look at your chart to find:
Tasks that take longer than the target time.
Areas where tasks can be redistributed to prevent bottlenecks.
Tasks that can be eliminated for better efficiency.
Display the Yamazumi chart in a visible place to encourage team discussions about improvements.
2 Quotes for the week:
“The message of the Kaizen strategy is that not a day should go by without some kind of improvement being made somewhere in the company.” – Masaaki Imai
“Practice the philosophy of continuous improvement. Get a little bit better every single day.” – Brian Tracy
1 Image for the week:


